

Pandas-Handling data in Python
pandas is a Python package providing fast, flexible, and expressive data structures designed to make working with “relational” or “labeled” data both easy and intuitive. It aims to be the fundamental high-level building block for doing practical, real world data analysis in Python. Additionally, it has the broader goal of becoming the most powerful and flexible open source data analysis / manipulation tool available in any language.
In this Blog, lets understand how to deal with data/ data sets using pandas.
Installing pandas
run the below command to install pandas
pip install pandas
Alternatively you may install Anaconda, which has pandas inbuilt.
Data Structures in Pandas
Pandas deal with 3 different data structures.
- Series: One Dimensional array with homogeneous data. Values of the series data structure can be altered but not the size.
- DataFrame: This is a 2-D array with Heterogeneous data . For example,It can hold and handle SQL table data.
- Panel: This is a 3-D array with heterogeneous data. Panel can be illustrated as a container of DataFrame.
Importing Pandas
import pandas as pd
The below codes uses pd to represent pandas
Read a csv file
df=pd.read_csv('fire_and_rescue_servicesTN.csv')
Write to csv file
pd.to_csv('name_of_the_file_to_save.csv')
Now the data in the csv is copied to df
df.head()
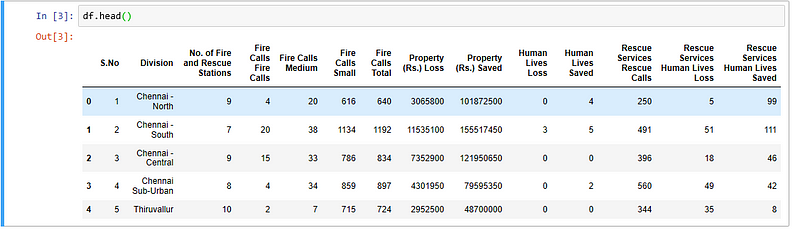
Prints the content of the Dataframe(ideally the whole data from the csv file)
df.dtypes
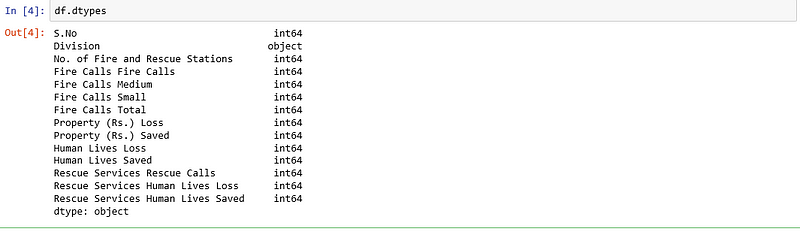
Prints the column names along with their Data types
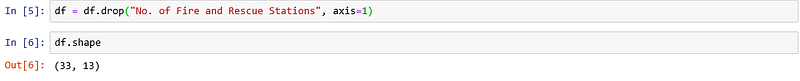
df = df.drop("No. of Fire and Rescue Stations", axis=1)
Drops the column by name ‘No. of Fire and Rescue Stations’
df.shape
returns the shape of the dataframe (rows,columns)
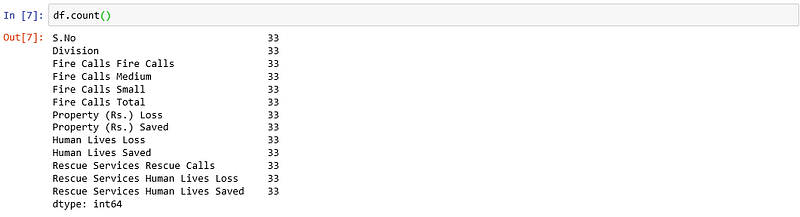
df.count()
returns the non-null data counts
df['No. of Fire and Rescue Stations']=0
creates a new column
df.columns = ['Column 1', 'Column 2', 'Column 3']
Renames the columns of a dataframe. Specify the new names.
#Sum of values in a DataFrame
df.sum()#Lowest value of a DataFrame
df.min()#Highest value
df.max()#Index of the lowest value
df.idxmin()#Index of the highest value
df.idxmax()#Statistical summary of the DataFrame, with quartiles, median, etc.
df.describe()#Average values
df.mean()#Median values
df.median()
.
df.apply(lambda x: x.replace('a', 'b'))
Replace the values in dataframe.
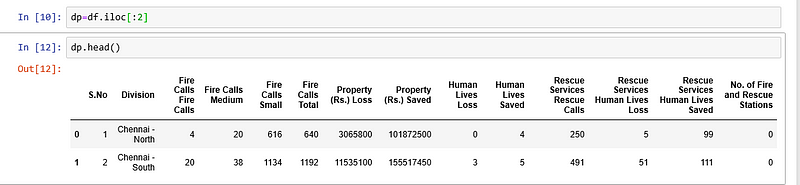
Selecting rows by position
dp=df.iloc[:2]
dp.head()
Selecting last two rows by position
dp=df.iloc[:-2]
dp.head()
Selecting rows by index
dp=df.loc[:2]
dp.head()
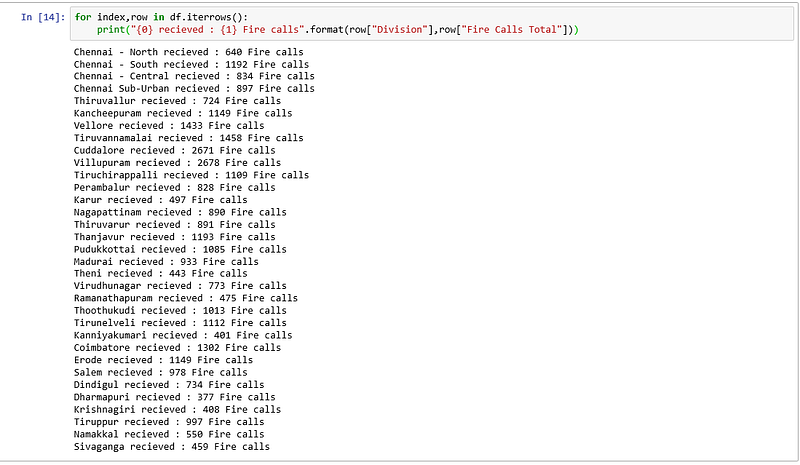
Iterate over the dataframe
for index,row in df.iterrows():
print("{0} recieved : {1} Fire calls".format(row["Division"],row["Fire Calls Total"]))
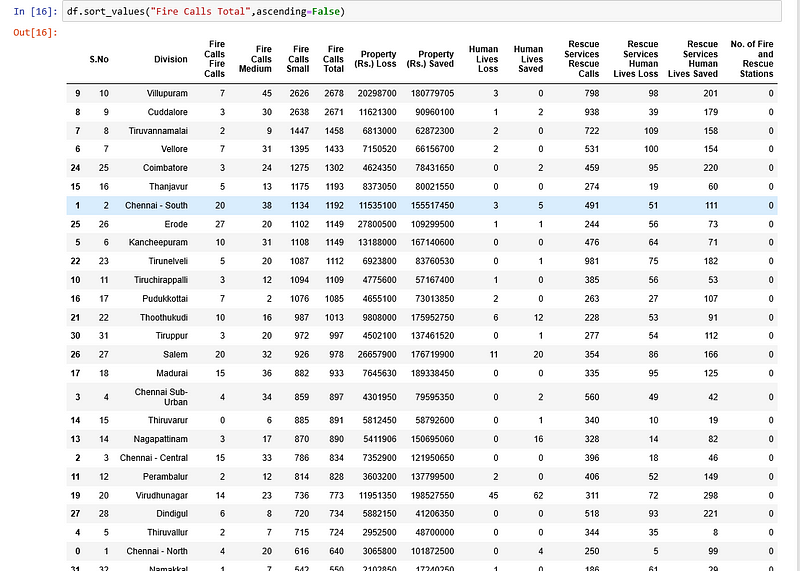
Sort Values
df.sort_values("Fire Calls Total",ascending=False)
Data: data.gov.in